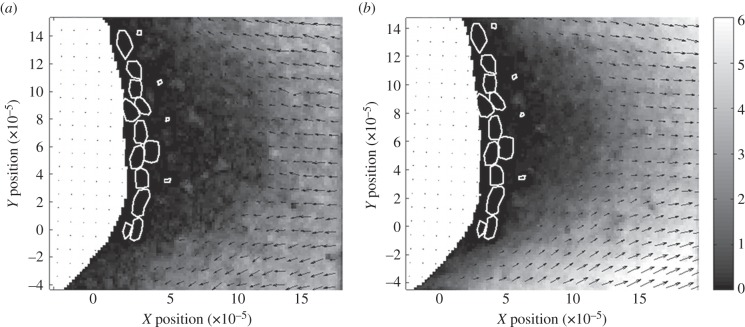
Figure 2.
Maps of velocity vectors of air relative to a cross-section of the lateral filament (white region) of an antennule of C. rugosus calculated from PIV measurements of flow relative to a dynamically scaled model and converted to air flow around a real antennule. Positions of the aesthetascs are shown by white outlines. Black arrows indicate direction of air flow. (a) Downstroke of the antennule. In the diagram, the antennule moves from left to right, so air flow relative to the antennule is from right to left, which is the positive X-direction. (b) Return stroke of the antennule. In the diagram, the antennule moves from right to left, so air flow relative to the antennule is from left to right, which is the negative X-direction. Greyscale colours indicate mean resultant air speeds in 10−2 m s−1. X- and Y-position scales in metres.

