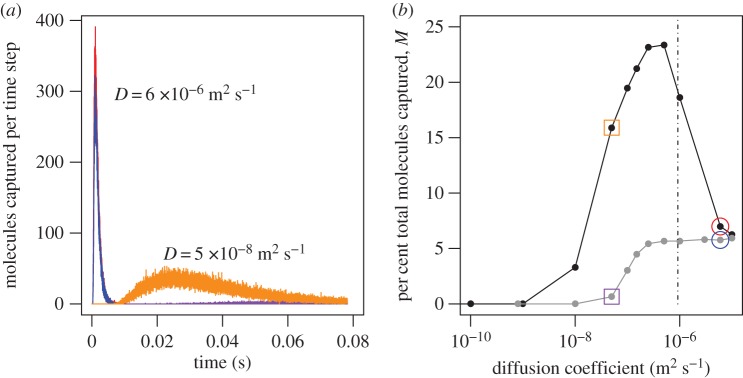
Figure 4.
(a) Molecules captured per time step on the ventral surfaces of the aesthetascs, plotted as a function of time for flicking (red, orange) and still (blue, purple) antennules. These simulations were done for odorants with different diffusion coefficients (D): red and blue D = 6 × 10⁻⁶ m2 s−1, orange and purple: D = 5 × 10⁻⁸ m2 s−1. (b) Per cent total molecules captured, M, during the downstroke and return stroke versus diffusion coefficient D in m2 s−1 for flicking antennules (black points and line) and still antennules (grey points and line). Two values are highlighted as they appear in (a): D = 6 × 10⁻⁶ m2 s−1 marked by circles and D = 5 × 10⁻⁸ m2 s−1 marked by squares.

