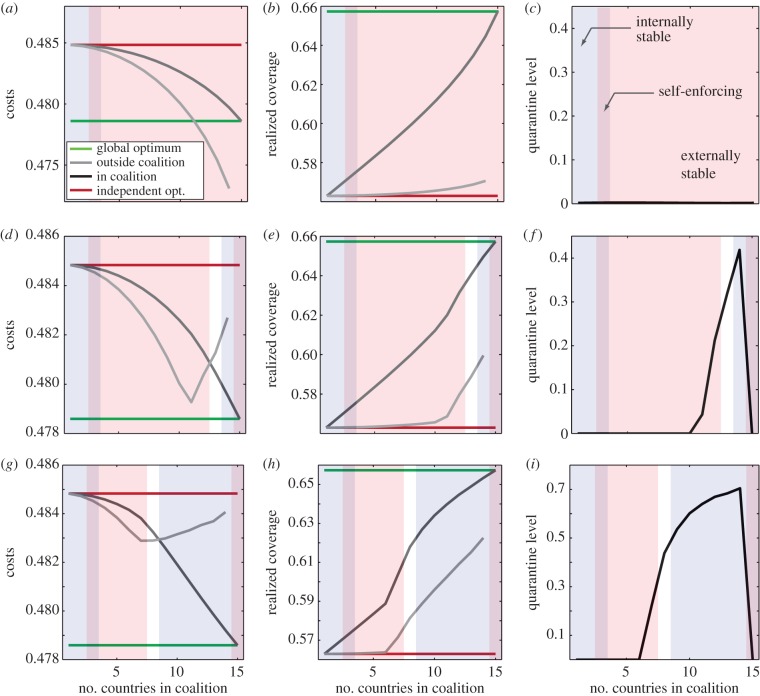
Figure 3.
Multi-patch SIR model with 15 coupled countries. Costs (a,d,g), realized coverage (b,e,h) and intensity of travel restrictions (c,f,i) for three control scenarios: no travel restrictions (a–c); expensive travel restrictions, q = 500 (d–f); inexpensive travel restrictions, q = 1000 (g–i). Green lines show vaccination coverage at the global optimum (b,e,h) and the corresponding costs (a,d,g). Red lines show realized coverage and corresponding costs when countries are acting independently (Nash equilibrium). Black and grey lines show optimal coverage and corresponding costs for signatories and non-signatories, respectively. Internally stable coalitions are shaded blue, externally stable coalitions are shaded orange, and their overlap shows self-enforcing coalitions. Coalitions in white are unstable. Parameters: R0 = 5, coupling strength = 20μ/(n − 1), ai = 0.1, cIi = 5.

