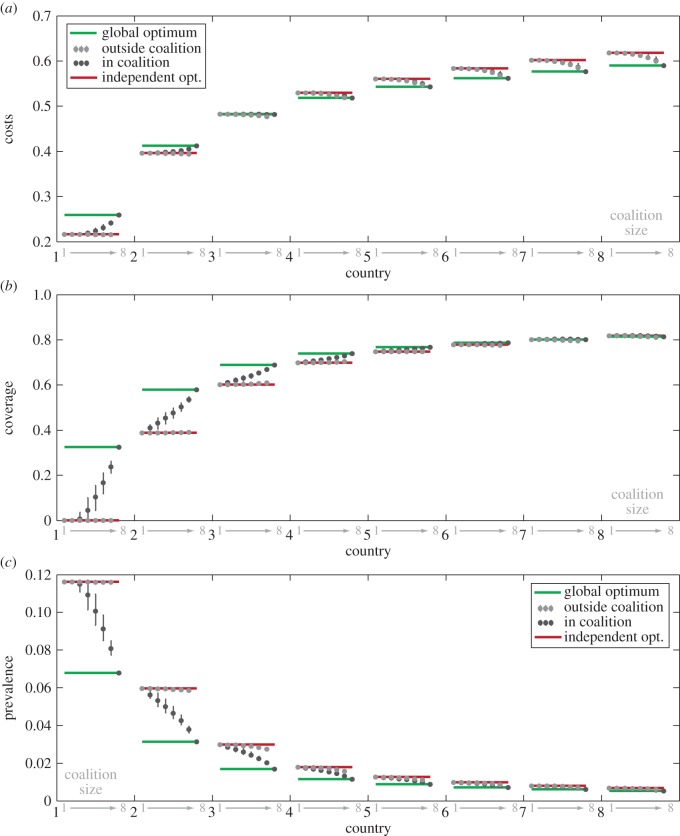
Figure 4.
SIR model for a system of eight asymmetric interconnected countries showing summary statistics for costs (a), coverage (b) or prevalence (c). For each country (shown on x-axis in black), the coalition sizes (indicated in grey on x-axis) are ordered from 1 (non-cooperative outcome) to 8 (fully cooperative outcome). There are  possible coalitions of size k, and here we show the mean value and range of optimization outcomes for a given country in a coalition of a given size. Circles show mean costs (a), coverage (b) or prevalence (c) for each country and each coalition size when that country is in coalition (black) and outside of coalition (grey). Whiskers show fifth and 95th quantiles. Red and green lines show independent and global optimum for each country, respectively. Cost of infection parameter varies linearly across countries from cI1 = 1 for country 1, and cI8 = 15 for country 8. R0 = 5, coupling strength = 10μ/(n − 1), ai = 0.1. All 248 optimizations are shown in electronic supplementary material, figure S4.

