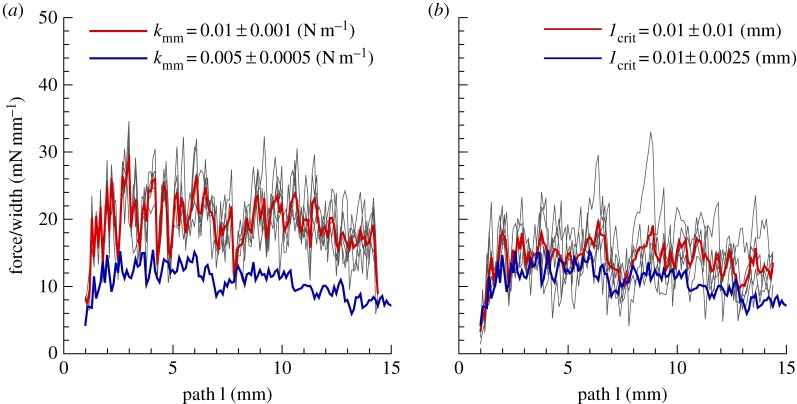
Figure 8.
The effect of inter-layer bond stiffness and critical length. Peeling force per unit width of the patch is plotted against the delamination length for (a)  and standard deviation of 10%; (b) lcrit = 0.01 mm and standard deviations of 25 and 100%. Note that the blue line is the result in figure 7a replotted here for comparison. DPD parameters are given in table 4. Fibres are oriented 30° relative to the pulling directions. (Online version in colour.)

