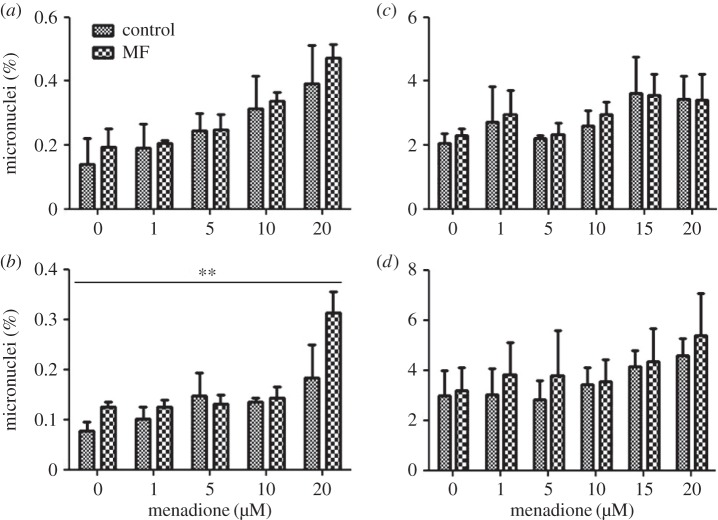
Figure 2.
Frequency of micronuclei in human SH-SY5Y neuroblastoma (a,b) and rat C6 glioma (c,d) cells exposed to 50 Hz MFs at 10 µT (a,c) or 30 µT (b,d). The MF treatments were combined with different menadione (MQ) concentrations. The data shown are mean ± s.e.m. values. Three experiments were performed with two samples per group in each experiment. Factorial ANOVA was used for statistical testing; statistically significant effects for the two factors (MF and MQ) and their interactions are reported below. SH-SY5Y, 10 µT experiment: MQ p < 0.001. SH-SY5Y, 30 µT experiment: MF p = 0.002; MQ p < 0.001; MF × MQ p = 0.024. C6 cells, 10 µT experiment: MQ p = 0.019. C6 cells, 30 µT experiment: none. The significances for the MF effects are given in the figure: **p < 0.01.

