Figure 5.
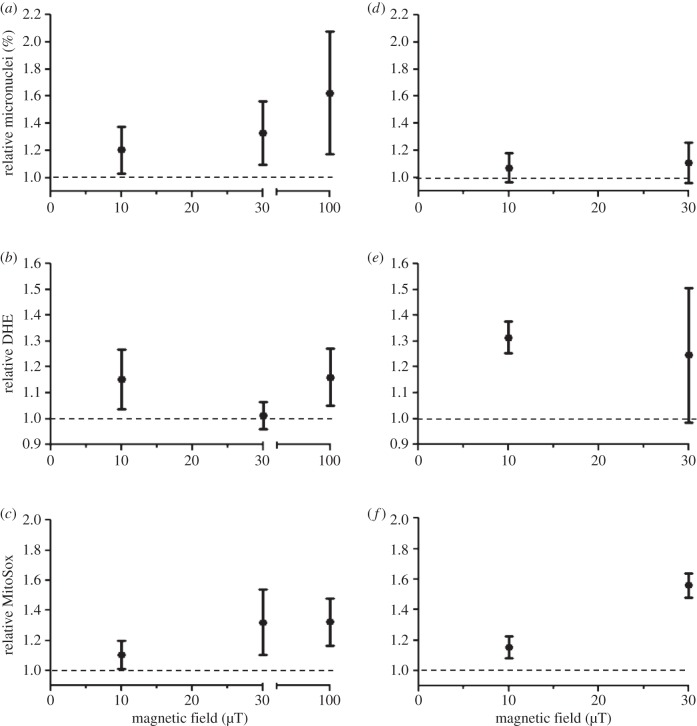
Exposure–response relationship for micronucleus formation (a,d), cytosolic superoxide level (b,e) and mitochondrial superoxide level (c,f) in human SH-SY5Y neuroblastoma (a–c) and rat C6 glioma (d–f) cells exposed to 50 Hz MFs. The data for 10 and 30 µT were pooled over all menadione (MQ) levels from the results of the present study and are given as relative values (value observed in the MF exposed sample divided by the value measured in the corresponding non-exposed sample), with 95% CIs. The data for 100 µT (SH-SY5Y cells) were similarly calculated from the data of the previous studies by Luukkonen et al. [14,15]. N = 15–21 (five to seven MQ levels, three replicate experiments).

