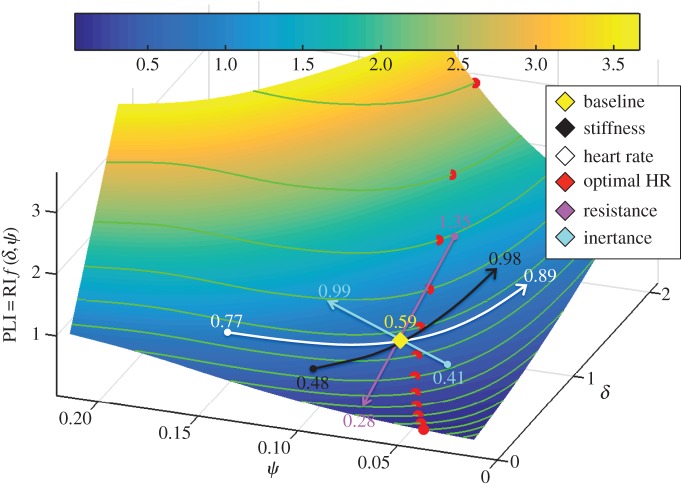
Figure 3.
All possible haemodynamic states of a mammalian cardiovascular system represented through the non-dimensional parameters. Pulsatile PLI is plotted versus changes in propagation number ( ) and decay number (
 ) at constant resistance index (
 = 3.85). Baseline condition (yellow marker, diamond) represents the systemic arteries of a healthy adult human that yields PLI = 0.59 at (δ, ψ) : (0.7, 0.074). The effects of changing a single cardiovascular parameter while keeping other non-dimensional numbers constant on the PLI are plotted as coloured curves, starting from half of the baseline parameter value (dot), passing from the baseline condition and ending at the tip of the arrow, at double its baseline value. Green curves on the surface represent constant vascular states (δ × ψ
=
constant); for each vascular state an optimal (δ, ψ) pair is computed (red markers, closed circles), where the PLI is at a local minimum. The colour legend shown on top corresponds to the value of the PLI. HR, heart rate; La, arterial inertance; Ca, arterial compliance; CT, total compliance; Rp, peripheral resistance; ρ, blood density; CO, cardiac output; BSA, body surface area.

