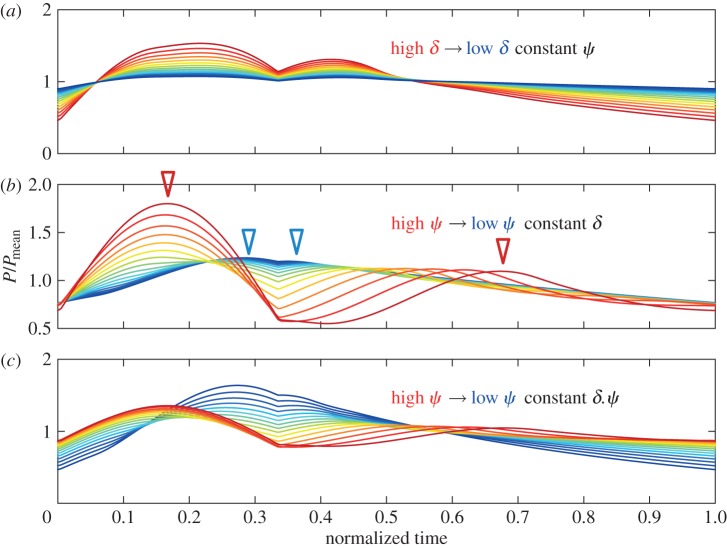
Figure 5.
Trends in the pressure waveform sampled at the ventricular–arterial junction due to systematic alterations of cardiovascular non-dimensional parameters. Plots display the changes in the normalized pressure waveform when δ is changed and ψ is fixed in (a), ψ is changed and δ is fixed in (b), ψ and δ are inversely changed since δ ×ψ is fixed in (c). In (b) arrows indicate the separation between the peaks of the forward (transmission) wave and the windkessel wave that closes as ψ decreases. Pressure is normalized with the mean arterial pressure (P/Pmean) and time is normalized with the heart rate (HR); normalized time = tHR. δ, decay number; ψ, propagation number.

