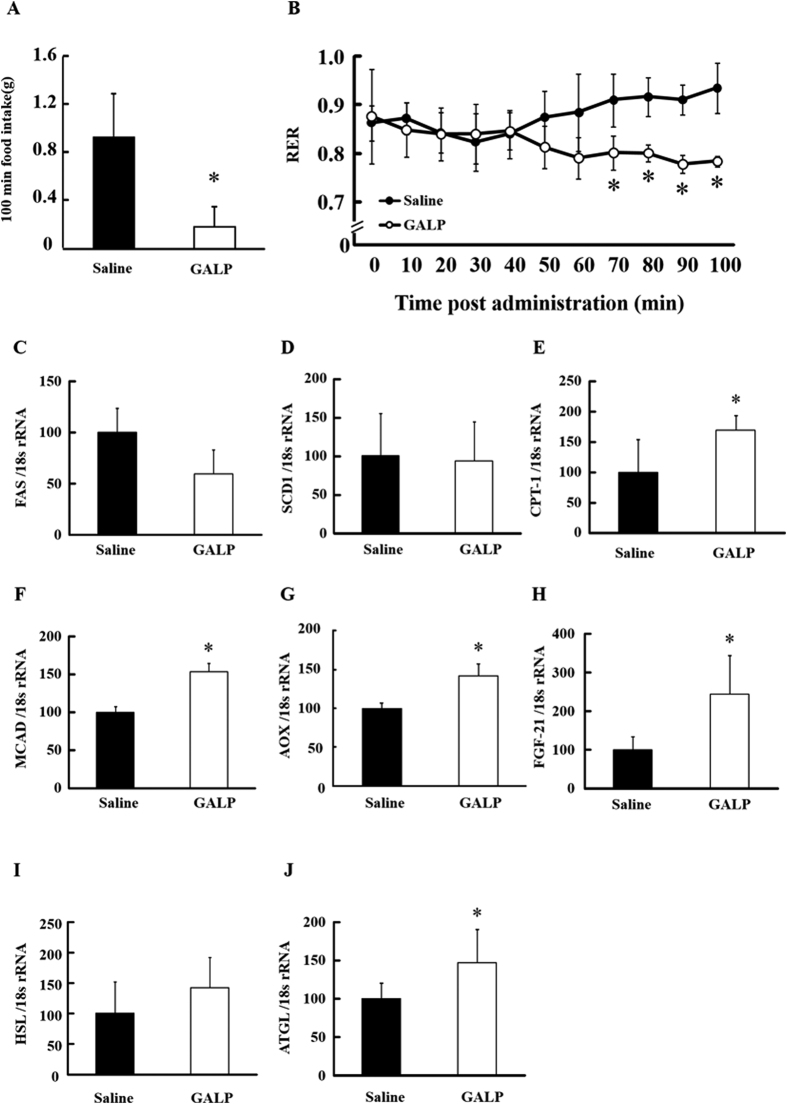
Figure 1. Effect of the i.c.v. administration of GALP on food intake, respiratory metabolism and mRNA expression levels in liver and WAT.
Food intake (A) and respiratory exchange ratio (RER) (B) after i.c.v. administration of saline or 2 nmol of GALP. Expression levels of hepatic FAS (C), SCD1 (D), CPT-1 (E), MCAD (F), AOX (G), FGF-21 (H) genes and adipose HSL (I) and ATGL (J) genes were measured by real-time PCR, and expressed relative to 18S rRNA. Values represent means ± S.D. (n = 6). *p < 0.05 versus saline.

