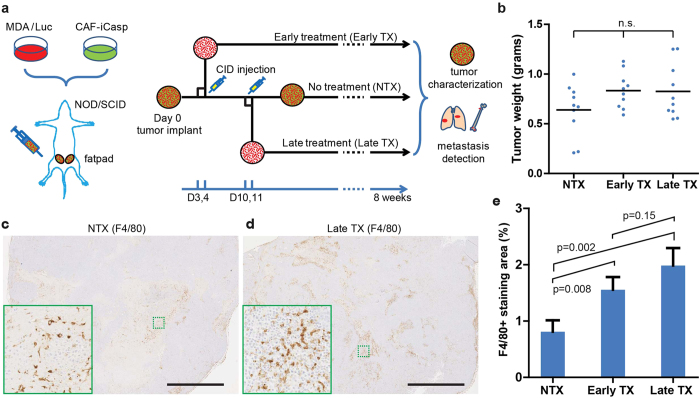
Figure 4. Three in vivo treatment conditions and phenotype analysis.
(a) Design of three conditions for in vivo CAF elimination in xenograft model, and quantifiable read-outs. (b) Tumor sizes at the end of the study are not statistically different (p > 0.05, one-way analysis of variance (ANOVA)). F4/80 staining of (c) NTX tumors and (d) Late TX tumors at the end of the study. (c,d) Scale bar: 2 mm. Insets (solid green boxes) are magnified areas in the dashed green boxes. (e) Comparison of F4/80+ staining in the tumor tissue sections (Student’s t-test). Total images analyzed: NTX: n = 26; Early TX: n = 25; Late TX: n = 32. Statistical comparisons are Student’s t-test. For all experiments, N = 5 animals per condition. Error bars: SEM.

