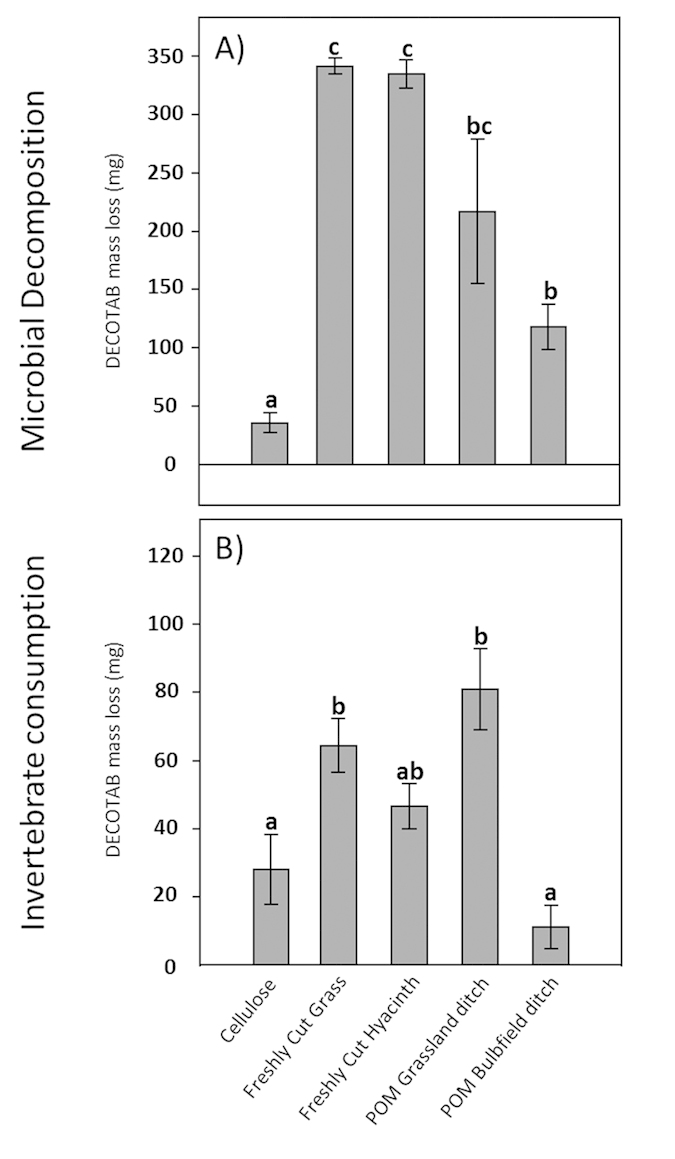
Figure 4. Microbial decomposition and invertebrate consumption of DECOTABs composed of different OM-sources in an OM-preference experiment in the field.

(A) DECOTAB mass (mg) loss after 9 weeks in small mesh-sized bags representing microbial decomposition, and (B) DECOTAB mass (mg) (mean ± s.d.) loss after 9 weeks in large mesh-sized cages representing invertebrate consumption. DECOTAB mass loss was corrected for microbial decomposition by subtracting values obtained in (A). Corresponding letters indicate statistical similarity (n = 6).
