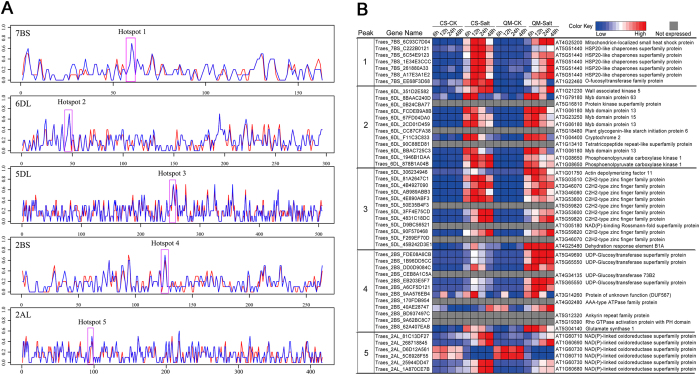
Figure 3. Chromosome distribution of salt stress responsive genes in CS and QM.
(A) Distribution of salt responsive genes in CS and QM was analyzed along each chromosome by using a sliding window algorithm. Line charts show the percentage of salt responsive genes in each window, red and blue lines represent CS and QM, respectively. We observed salt responsive genes displayed a biased distribution and formed salt responsive hotspots. Pink boxes marked five representative hotspots. (B) Salt stress responsive genes contained in the five marked hotspots. Heatmap shows expression profiles of these genes in responsive to salt stress, and wheat genes were annotated by BLAST searching against Arabidopsis protein database.

