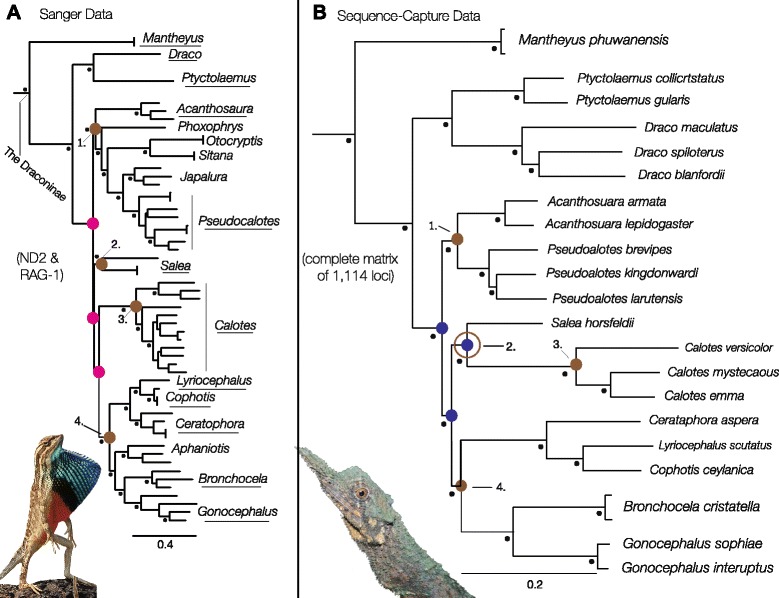
Fig. 2.

a Bayesian analysis (in MrBayes) of ND2 and RAG-1 data, with black dots denoting nodes with posterior probabilities above 0.95. Brown nodes indicate four well-supported species groups (1–4; see text for details) and pink nodes identify poorly supported relationships among these species groups. Underlined taxon names are genera selected for UCE enrichment. b Multi-species coalescent (“species tree”) from the species tree estimation using average coalescence times STEAC analysis, using the complete matrix of 1114 UCE loci. Black dots denote nodes with 100 bootstrap support. Brown nodes indicate the four species groups (Group 2 = brown circle; see text for discussion). Blue nodes identify problematic nodes recovered in Likelihood analysis of the Sanger dataset, resolved with sequence-capture data
