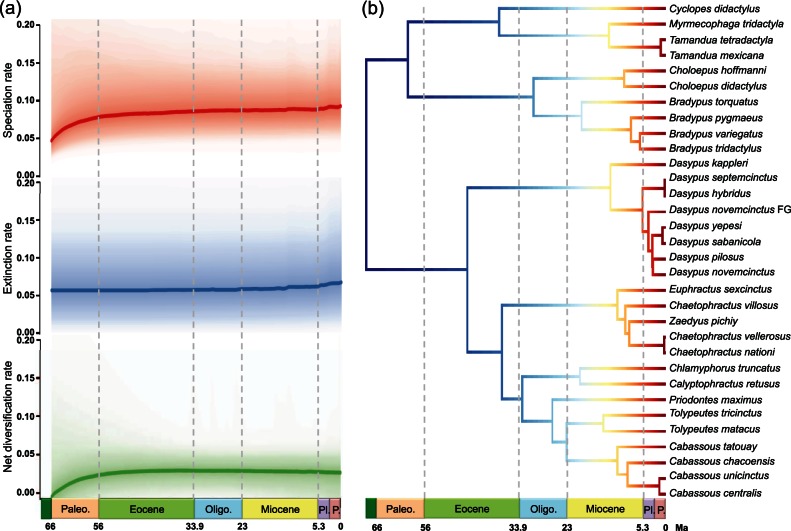
Fig. 4.
Bayesian analysis of macrevolutionary mixtures in Xenarthra. (a) Bayesian reconstruction of rate variations in speciation, extinction, and net diversification through time. (b) Maximum a posteriori probability shift configuration represented as a phylorate plot showing variations in speciation rates (cool colors = slow, warm = fast) along each branch of the xenarthran phylogeny. Each unique color section of a branch represents the mean of the marginal posterior density of speciation rates on a localized segment of a phylogenetic tree. The rate variation pattern for lineages involves a uniform, although slight, temporal acceleration in speciation rates. “Dasypus novemcinctus FG” denotes the French Guiana lineage. Paleo. = Paleocene; Oligo. = Oligocene; Pl = Pliocene; P = Pleistocene.

