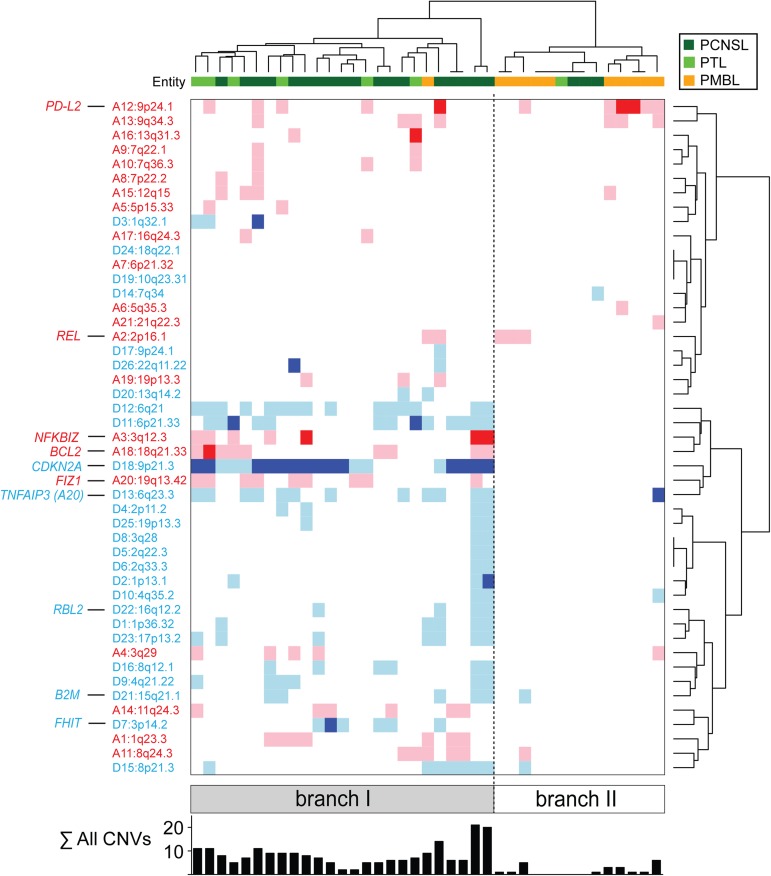
Figure 2.
PCNSLs, PTLs, and PMBLs clustered by recurrent CNAs. (A) Unsupervised bihierarchical clustering of all 47 GISTIC-defined CNAs (y-axis) in 39 primary LBCLs (21 PCNSLs [dark green], 7 PTLs [light green], 11 PMBLs [orange]; x-axis). Copy gains, red; copy losses, blue; color intensity corresponds to magnitude of CNA. The sum of all GISTIC-defined CNAs per sample is listed below as a bar graph. Top genes by integrative analyses of CN and transcript abundance are indicated on the left.

