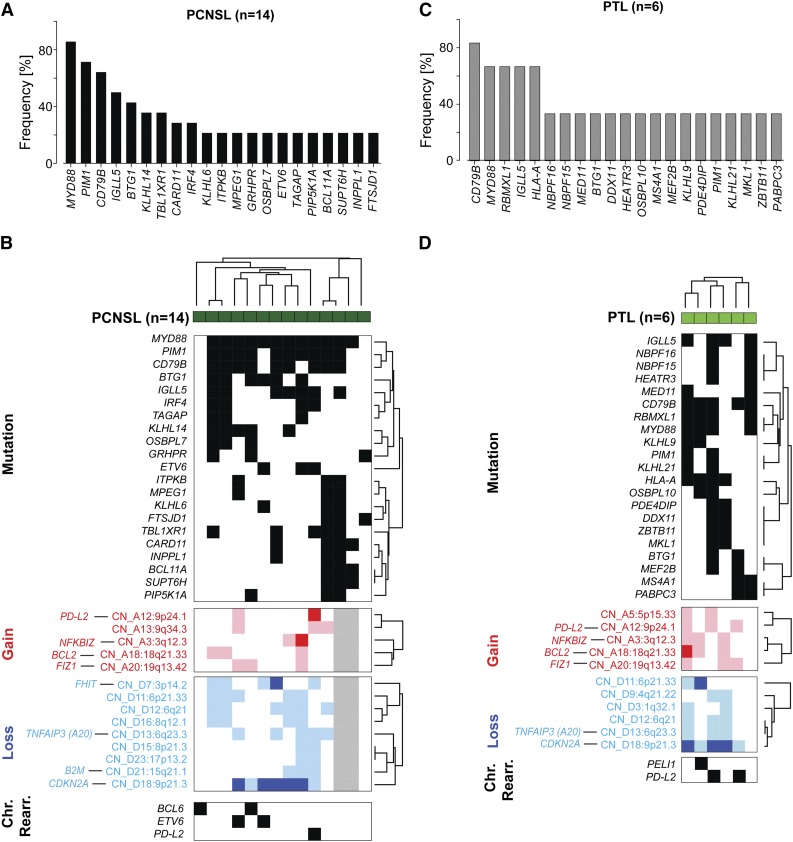
Figure 4.
Somatic mutations and patterns of genetic alterations in PCNSL and PTL. (A) Frequency of mutations in PCNSLs (mutations initially identified by WES in 5 tumor/normal pairs and subsequently assessed in 9 additional tumors without paired normals by RNA-Seq). See also supplemental Table 5D-H. Only genes mutated in at least 20% (3 patients) are shown. (B) Mutations occurring in at least 20% (3/14) of PCNSL samples (dark green) are plotted in a black-and-white–coded matrix (x-axis, samples; y-axis, mutations; black, mutation present; white, mutation absent) and clustered bihierarchically. CNAs in these PCNSLs are visualized as a color-coded heat map below; copy gain, red; copy loss, blue; not available, gray; color intensity corresponds to magnitude of CNA. Top genes by integrative analyses of CN and transcript abundance are indicated on the left, y-axis. Chromosomal rearrangements of BCL6, ETV6, or PD-L2 are added below. (C) Frequency of mutations in 6 PTLs as assessed by RNA-Seq. Only mutations present in at least 2 patients are shown (supplemental Table 5I, full list). SNVs were filtered for known SNPs; only SNVs previously deposited in COSMIC or reported to be mutated in DLBCLs/PCNSLs are shown. (D) Mutations present in at least 2 PTLs (y-axis) are plotted in a black-and-white–coded matrix as in (B) and clustered bihierarchically. CNAs in these PTLs are visualized as a color-coded heat map below, and selected chromosomal rearrangements modifying BCL6 (PELI1) and PD-L2 are added at the bottom.

