Figure 6.
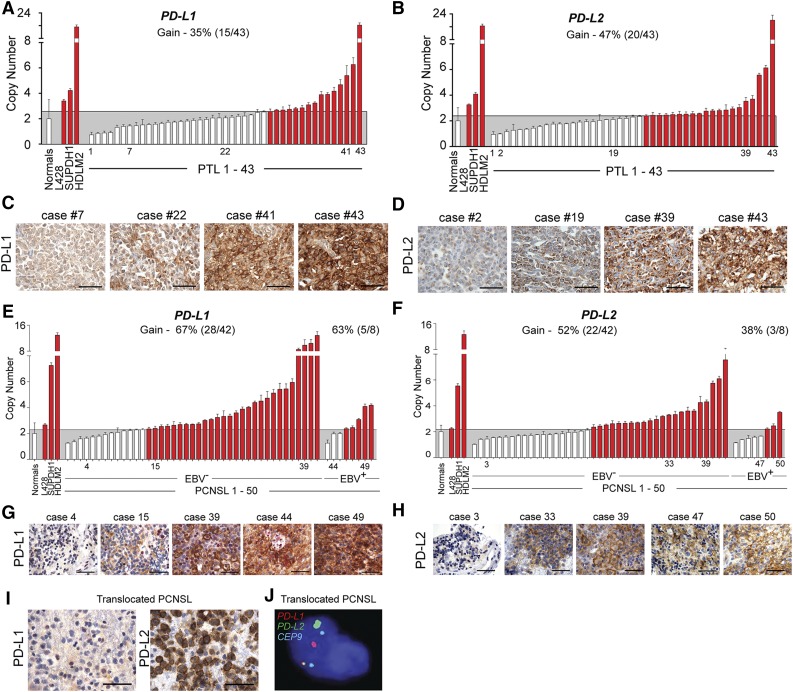
Genetic alterations of PD-L1 and PD-L2 in PTL and PCNSL. (A) CNs of PD-L1 in 43 PTL cases from the extension cohort. Normals include 5 tonsils and 5 reactive lymph nodes. The upper 95% confidence interval of the normals was used as a threshold for CN gain in the PTLs. Indicated cHL cell lines with known PD-L1 copy gain were used as controls. Cases with copy gain are highlighted in red. Error bars reflect standard deviation. (C) PD-L1 protein expression in indicated cases from (A). The scale bar represents 100 μm. (B) CNs of PD-L2 in 43 PTL cases from extension cohort. Controls are as in (A). (D) PD-L2 protein expression in indicated cases from (B). (E) CNs of PD-L1 in 50 PCSNL cases (42 EBV– and 8 EBV+) from the extension cohort. Details are as in (A). (F) CNs of PD-L2 in 50 PCSNL cases (42 EBV– and 8 EBV+) from extension cohort. Controls are as in (A). (G) PD-L1 protein expression in indicated cases from (E). The scale bar represents 100 μm. (H) PD-L2 protein expression in indicated cases from (F). (I) PD-L1 (left panel) and PD-L2 (right panel) of the PCNSL case with wild-type PD-L1/2 CN. (J) Split-apart FISH assay of the PCNSL in (I). PD-L1 in red, PD-L2 in green and centromeric probe (CEP9) in aqua.

