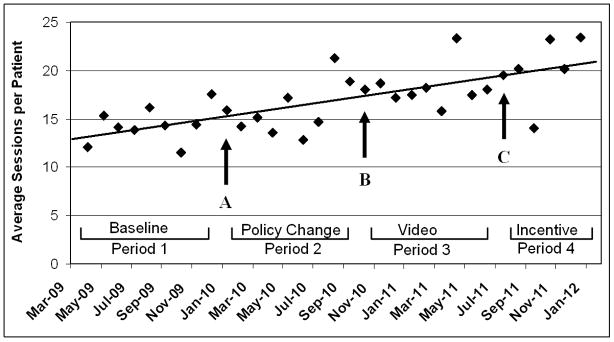
Figure 1.
Quality Improvement Activities and Their Effects on Patient Attendance at Cardiac Rehabilitation
Each point represents the average number of sessions per patients enrolling in cardiac rehabilitation for the given month. Point A represents a policy change towards maximizing total number of sessions. Point B represents institution of the patient orientation video. Point C represents the institution of the motivational/incentive program. The comparative periods are shown visually. As seen, there is a significant positive trend in the average sessions per patient over time (r = 0.18, p < 0.001.)

