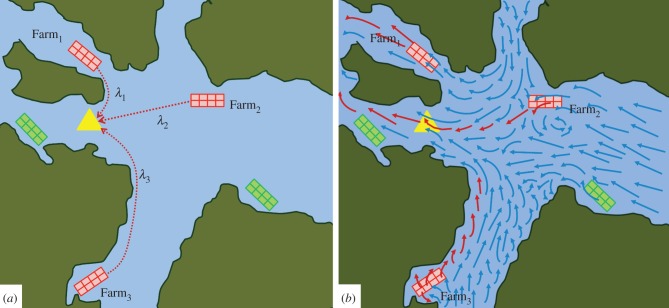
Figure 4.
Force of infection, λ, exerted from surrounding farms j = 1, 2, 3, on a point location (yellow triangle) can be calculated (a) using distance as a proxy, such that λj is larger for closer farms. In this example, λ1 > λ2 > λ3. In panel (b), λ is calculated more explicitly as per the water flow direction and speed (i.e. longer arrows represent faster flow). Even though farm1 is closest, it is not a likely source of infection given the direction of flow. Further, farm3 is located too far away and the pathogen is not viable by the time it reaches that location of interest. Infection status of farms is shown as dark red (infected) and light green (not infected), and of water carrying viable pathogens as dark red (infected) and light blue (non-viable). (Online version in colour.)

