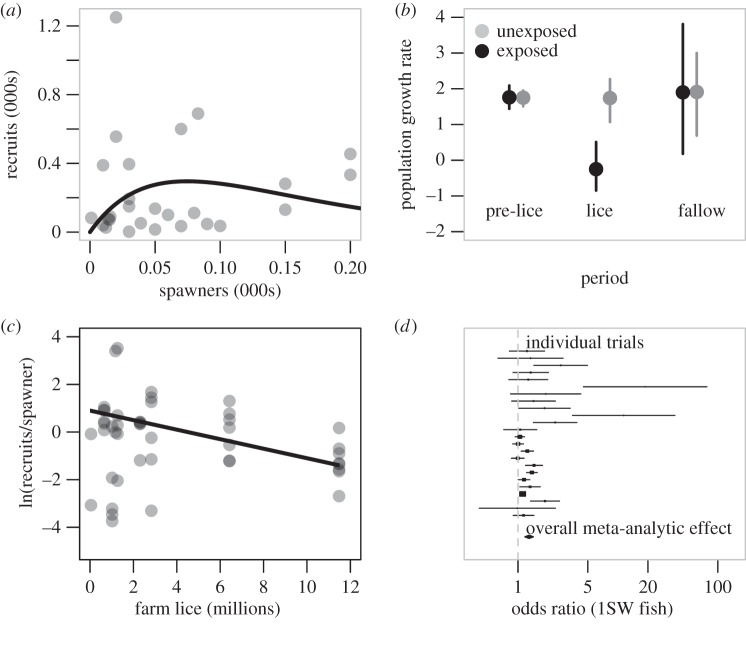
Figure 5.
Stock–recruitment relationships evaluating the effect of sea lice on wild salmon population dynamics. (a) An example Ricker stock–recruitment relationship (the Kwalate coho population in British Columbia) illustrating the observed (grey circles) and predicted (black line) number of individuals in one generation (recruits) produced by spawners in the previous generation. Stock productivity is the maximum ratio of recruits to spawners and is the initial slope of the stock–recruitment curve [25]. (b) Coho salmon population growth rates (±95% bootstrapped CIs) from exposed (black circles) and unexposed regions (grey circles) prior to and during years when salmon lice epidemics were observed in exposed populations as well as during a fallow treatment year [25]. (c) Productivity (loge (recruits per spawner)) of coho salmon populations in relation to the estimated number of lice on farmed fish during juvenile coho seaward migration. The black line is the estimated relationship between productivity and louse abundance based upon a hierarchical linear regression [26]. (d) A random effect meta-analysis of chemotherapeutant treatment on the likelihood of adult Atlantic salmon returning to spawn. Lines are the 95% CIs of the effect size for each trial with the closed diamond representing the overall meta-analytic effect across all studies [3].

