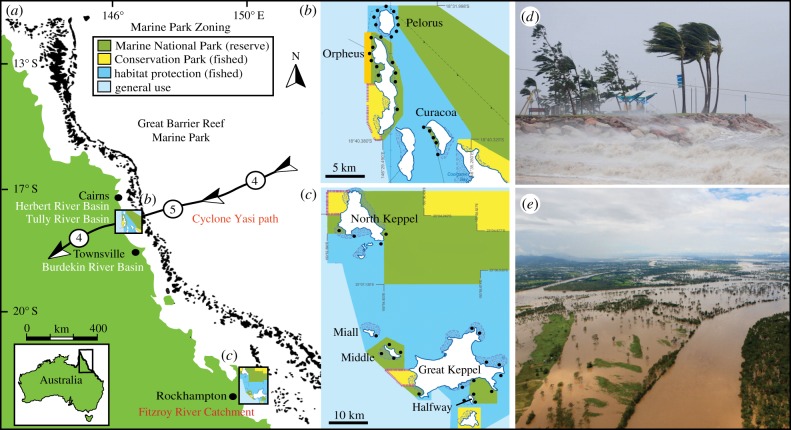
Figure 1.
Locations of 47 reef sites surveyed in two regions of the (a) Great Barrier Reef Marine Park, Australia. Surveys were conducted in the (b) Palm Islands in 2012, 1 year following an acute tropical cyclone; and (c) Keppel Islands in 2013, two months following 14 weeks of chronic exposure to terrestrial flooding from the Fitzroy River Catchment. Areas shaded in green are no-take reserves and represent 33% of the Marine Park; areas shaded in dark blue are open to fishing and comprise 28% of the Marine Park. Activities permitted in each zone are listed in the electronic supplementary material (table S1) and at www.gbrmpa.gov.au. Wind gusts and modelled cyclone path (arrow direction) obtained from the Australian Bureau of Meteorology (www.bom.gov.au), with tropical cyclone intensity category indicated at three time points in the open circles between arrows highlighting the cyclone path. Photographs illustrate (d) coastal wind and wave intensity during Cyclone Yasi in February 2011 and (e) severe flooding of the Fitzroy River Basin in January 2011. Photos: Jonathan Wood and Ian Hitchcock (Getty Images).

