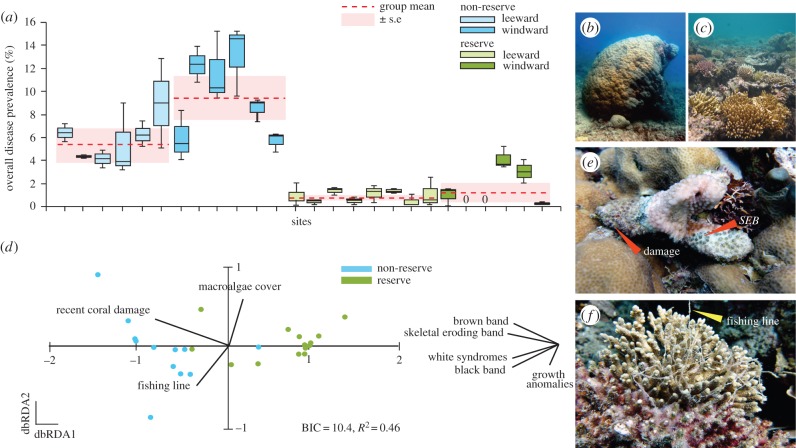
Figure 2.
Comparisons of (a) coral disease prevalence among reserve (light and dark green) and non-reserve (light and dark blue) sites in the Palm Islands 1 year following a severe tropical cyclone. Surveys were conducted on both (b) windward and (c) leeward reef sites. Each box and solid line represents the first, third and second quartiles, respectively, while whiskers indicate data range. Dashed line (red) represents group means ± s.e. (pink). Letters represent significant differences among groups using a generalized linear hypothesis test with pairwise comparisons and Bonferroni correction. (d) Visual representation of similarities among coral disease assemblages between reserve and non-reserve sites using a distance-based redundancy analysis (dbRDA). Vectors depict significant environmental and biological variables (electronic supplementary material, table S2) forming the best-fit model identified using Bayesian information criterion (BIC). Disease vectors to the right of each panel represent coral diseases super-imposed on the ordination as vectors (Pearson correlations with vectors offset for ease of distinguishing them from the main panels). The length and direction of the vectors represent the strength and direction of the relationship. dbRDA1=86.7% fitted and 39.8% total model variation; dbRDA2=11.7% fitted and 5.4% total model variation. Photographs of (e) skeletal eroding band (SEB) disease affecting a damaged coral fragment and (f) a coral colony entangled in derelict fishing line.

