Figure 2.

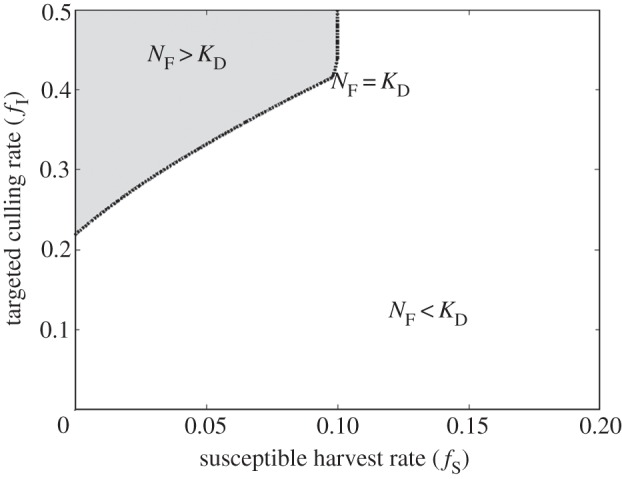
Isocline showing combinations of susceptible host harvest rate (fS) and targeted culling rate (fI) when the disease-impacted fished population density (NF) is equal to the unfished disease-impacted population (KD).

Isocline showing combinations of susceptible host harvest rate (fS) and targeted culling rate (fI) when the disease-impacted fished population density (NF) is equal to the unfished disease-impacted population (KD).