
Figure 1.
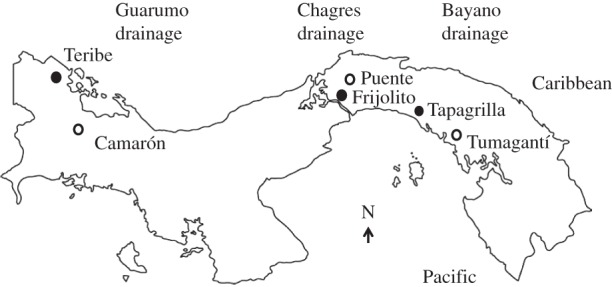
Map of the Republic of Panama showing the six field sites within three drainages. Filled circles indicate the populations with relatively high predation pressure within a drainage; open circles indicate the populations with relatively low predation pressure within a drainage. For data on predation pressure, see the electronic supplementary material, table S1.