
Figure 2.
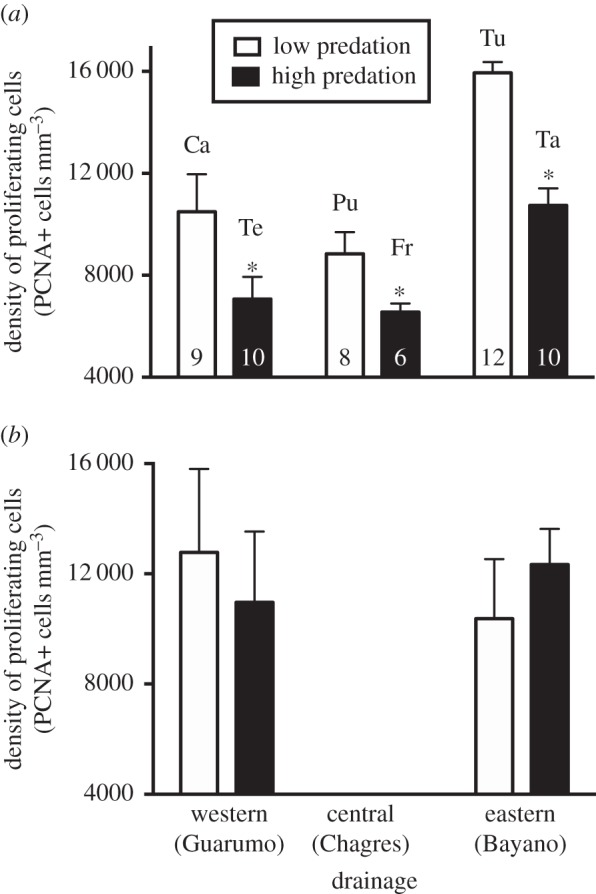
Brain cell proliferation in the (a) forebrain and (b) midbrain in high- (black bars) and low-predation (white bars) populations, comparing populations within three drainages. Data (mean ± s.e.) are from intact fish; no data were available from the midbrain in the Chagres drainage. For the forebrain, the high-predation population had significantly lower density of proliferating cells than the low-predation population in all three drainages; there were no population differences in the midbrain. Asterisks indicate significant differences between populations within a drainage. Sample sizes are at the base of each bar. Tu, Tumagantí; Ca, Camarón; Ta, Tapagrilla; Pu, Puente; Fr, Frijolito; Te, Teribe.