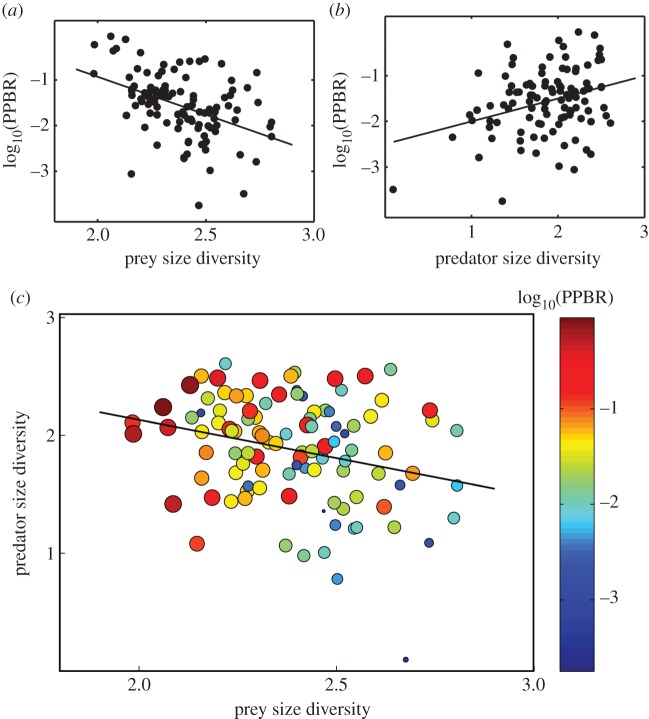
Figure 1.
Effects of (a) prey size diversity on biomass transfer efficiency (log10(PPBR)) (r = −0.43, p < 0.0001), (b) predator size diversity on biomass transfer efficiency (log10(PPBR)) (r = 0.32, p < 0.0001) and (c) prey and predator size diversities on biomass transfer efficiency (log10(PPBR)). In panel (c), colour as well as symbol size indicate the biomass transfer efficiency. The solid line represents the relationship between prey and predator size diversity (r = −0.27, p = 0.006).

