Figure 1.
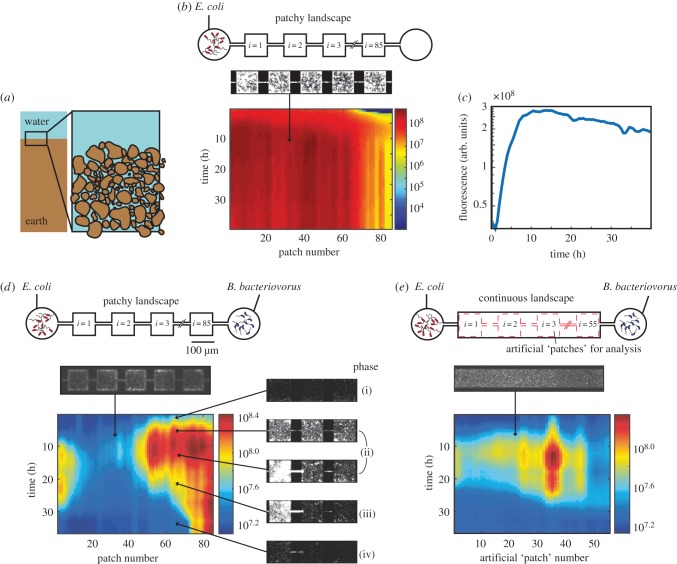
On-chip predator–prey system. (a) Soil consists of a three-dimensional network of micrometre-sized patches. (b) A control experiment, in which only prey is introduced to a patchy landscape, consisting of coupled patches (top). A heatmap of a kymograph (depicting space horizontally and time vertically, the colour bar indicates logarithmically scaled fluorescent intensity in arbitrary units) showing the population dynamics of fluorescently labelled E. coli. (c) The mean prey growth dynamics over all patches shows the familiar phases of bacterial growth: exponential phase and entry into stationary phase (at t = 10 h). (d,e) Predator–prey dynamics in the presence of predator in a patchy landscape (d) and a ‘continuous’ landscape (e). Software-generated ‘virtual’ patches that are used in data analysis of the continuous habitat are indicated by red dashed lines. In both habitats there initially is a steep rise in fluorescence which corresponds to the growth of E. coli, followed by a death phase in which E. coli lyse after predation. Each pixel represents a single habitat patch. Microscopy images show representative snapshots of the population dynamics in phases (i)–(iv), arrows indicate the approximate space and time of image acquisition.

