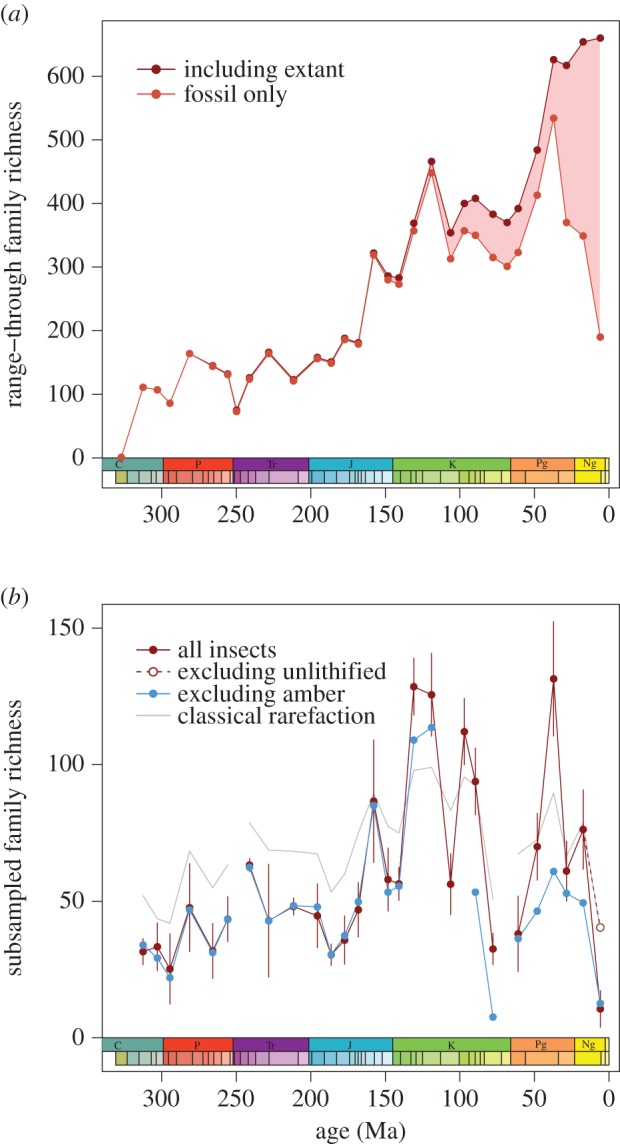
Figure 1.

(a) Range-through family richness trends generated by extending ranges of extant families to the Recent (dark red) and only considering fossil data (light red). Including extant data imposes the Pull of the Recent bias (shaded area), while the fossil-only curve suffers from edge effects (notably the decrease in the youngest interval). As a result, these curves are not accurate records of insect richness, particularly when including extant data. (b) Sampling-standardized trends in insect family richness. Curves show shareholder quorum subsampling of all insects (red) and excluding amber fossils (blue), as well as classical rarefaction subsampling (grey line). Error bars (shown for all insects only) are 1 s.d. The open circle shows richness after excluding unlithified and poorly lithified occurrences. Differences between the pre-Cretaceous curves for all insects and when excluding amber arise because sampling-standardization methods take random subsamples of the dataset. The Early Triassic and Maastrichtian intervals are poorly sampled and cannot be analysed with these methods. (Online version in colour.)
