
Figure 3.
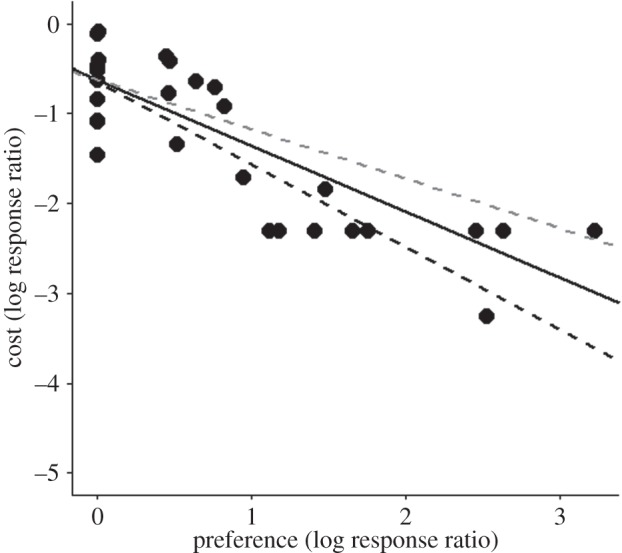
The relationship between the fitness costs of ecological traps and the preferences animals exhibit for them (both log response ratios). Zero values on the x-axis represent equal preference traps. Three potential effect sizes are shown for nine studies where no data on fitness reductions were present: a 10 times reduction in fitness in traps (solid black line), a 5 times reduction (dashed grey line) and a 20 times reduction (dashed black line)—see the methods section for further details. Linear regression models for each of these effect sizes and when these studies were removed all p < 0.01, R2 > 0.50.