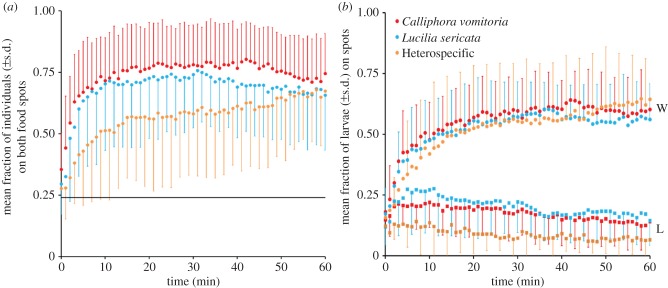
Figure 2.
Aggregation kinetics of conspecific and heterospecific groups. (a) Mean fraction of individuals in conspecific (C. vomitoria (red, N = 26), L. sericata (blue, N = 28)), and heterospecific groups (orange, N = 24) on both food spots over time. The horizontal line corresponds to a random distribution of individuals on the surface, which was calculated according to Canonge et al. [37]. No differences were observed at t = 0 min between a random distribution and the three observed distributions (bilateral tests: C. vomitoria: u = 1.37, p > 0.05; L. sericata: u = 0.69, p > 0.05; heterospecific group: u = 0.42, p > 0.05; ualpha = 1.96). Significant differences from a random distribution were observed 2 min after trial initiation for the L. sericata groups, 1 min after trial initiation for the C. vomitoria groups, and 4 min after trial initiation for the heterospecific groups (using bilateral tests). The two monospecific kinetics presented no differences from t = 0 min to t = 60 min (Mann–Whitney tests). Multiple comparisons among the three conditions showed no significant differences from t = 40 min (Kruskal–Wallis (KW = 5.12, p = 0.08) to t = 60 min (KW = 2.48, p = 0.29). Such comparisons showed that heterospecific groups aggregate more slowly than the two monospecific groups on both spots. (b) Aggregation dynamics of 40 larvae in conspecific (C. vomitoria, N = 26; L. sericata, N = 28) and heterospecific groups (24 replicates; 20 individuals of each species). Mean fraction of individuals 29 (±s.d.) found on the Winner spot (W; represented by circles) and the Loser spot (L; represented by squares). No differences were observed at t = 60 min between the three conditions with respect to the Winner spot (KW = 3.72, p = 0.16) or the Loser spot (Dunn's test, α = 0.017, p > 0.05). (Online version in colour.)

