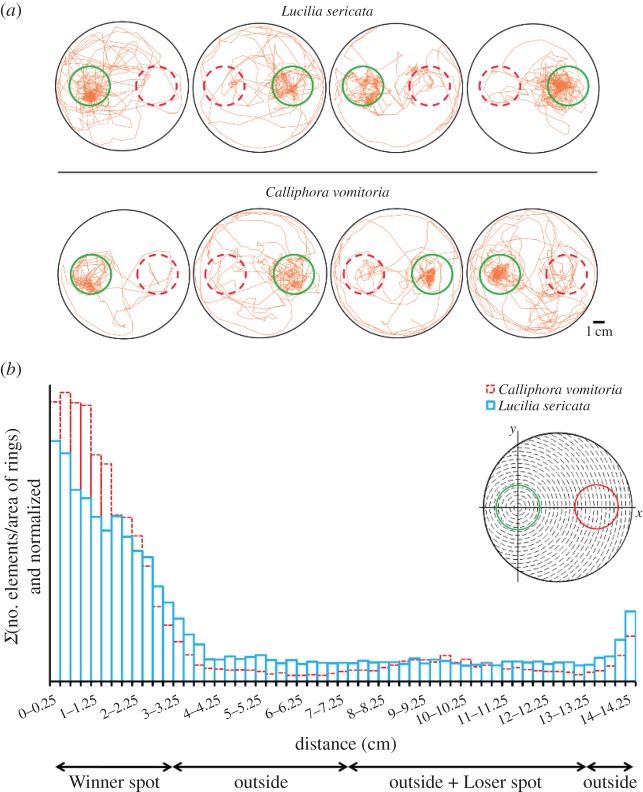
Figure 3.
Individual behaviour of larvae. (a) Tracks of eight larvae followed for 60 min during the conspecific experiment. The green circles represent the Winner spots, and the dotted red circles represent the Loser spots (diameter: 3.25 cm). (b) Relative density of tracked larvae according to the distance (cm) from the centre of the Winner spot (conspecific experiments, N = 20 for each species). The centre of the Winner spot was used as the reference coordinate (the Winner spot is represented by green, and the Loser spot is shown in red; diameter: 3.25 cm). The sum of the number of elements (distance to the centre of the Winner spot) divided by the ring area (see the illustration) is shown along the Y-ordinate axis. (Online version in colour.)

