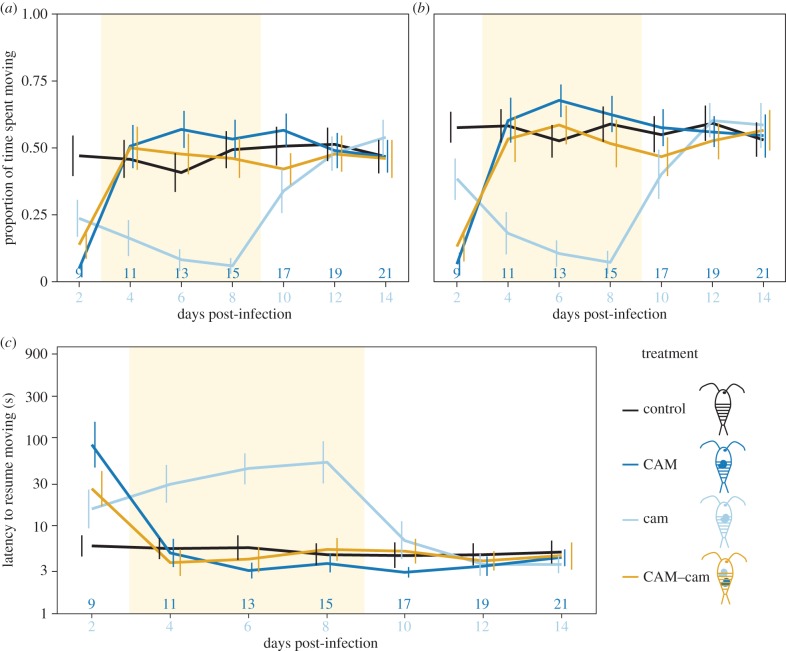
Figure 2.
Intraspecific conflict within Camallanus lacustris. Error bars indicate 95% CI. (a) Activity (proportion of time spent moving) within 1 min after a simulated predator attack, (b) activity during 1 min after a recovery period, (c) latency to resume moving after a simulated predator attack. Note that the y-axis is on a log-scale. The upper labels on the x-axis indicate the age of C. lacustris from day 0, the lower labels indicate the age of C. lacustris from day 7. The coloured area indicates when a conflict over host manipulation should occur. n = 40 per treatment. Control, uninfected control copepods (figure 1a); CAM, copepods infected with C. lacustris on day 0 (figure 1b); cam, copepods infected with C. lacustris on day 7 (figure 1c); CAM–cam, copepods infected with one C. lacustris on day 0 plus one on day 7 (figure 1f).

