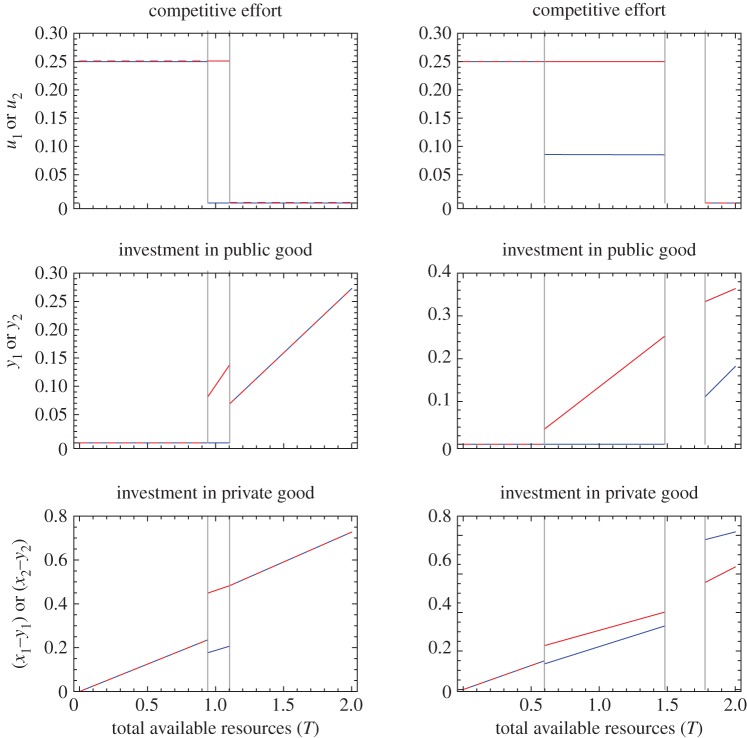
Figure 4.
Equilibrium levels of competitive effort (top row), investment in the public good (middle row) and in their own private good (bottom row) by players 1 (blue lines) and 2 (red lines), as a function of total available resources T, when both place equal value on the public good (a1 = a2 = 0.6; left column), and when individual 1 places less value on the public good than does player 2 (a1 = 0.4, a2 = 0.8; right column). Vertical grey lines demarcate zones that yield qualitatively different outcomes. Note that when both players place equal value on the public good (a1 = a2 = 0.6; left column), the intermediate zone that yields asymmetric outcomes features two alternative, ‘mirror-image’ equilibria; only one is shown here. When individual 1 places less value on the public good than does player 2 (a1 = 0.4, a2 = 0.8; right column), only one asymmetric equilibrium exists for any given value of T, as shown; there is also a zone in which the model yields no globally stable equilibrium.

