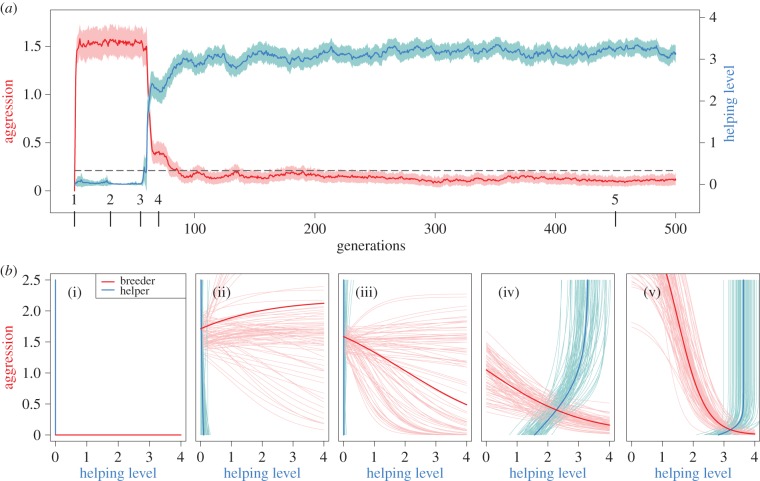
Figure 4.
Evolution of negotiated help. (a) Evolutionary dynamics of aggression (red line, left y-axis) and helping level (blue line, right y-axis) in a representative simulation run. Coloured bands represent 1 s.d. of the within population variation, above and below the mean. (b) Reaction norms of breeders (red) and helpers (blue) at five different points in time. (b(i)) Simulations start with unresponsive strategies that provide no help, and impose no aggression. (b(ii)) Breeders rapidly evolve high levels of aggression, thereby driving idle helpers out of their territories. (b(iii)) At some point in the simulation, the average reaction norm of the breeder (thick red line) becomes a decreasing function; (b(iv)) helpers in response evolve higher levels of help. Finally (b(v)), an evolutionary equilibrium results where helpers provide a high level of help, and breeders impose low levels of aggression.

