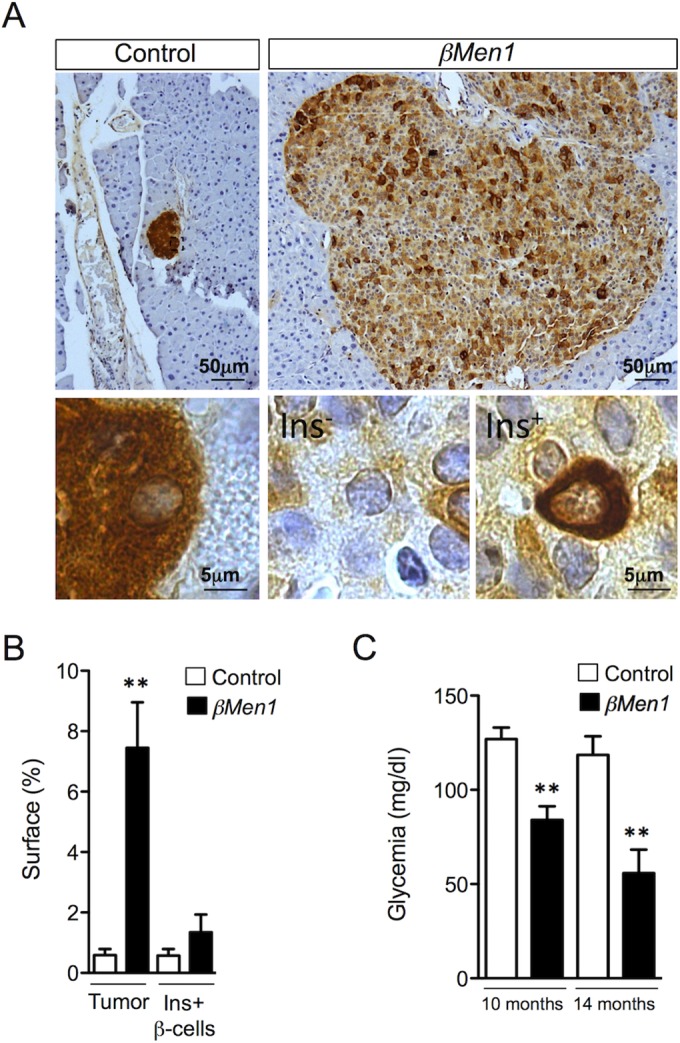
FIG 1.

Analysis of insulin expression in βMen1 β-cell tumors reveals heterogeneity in intratumoral insulin expression. (A) Representative insulin staining heterogeneity seen in 14-month-old control and βMen1 tumors. Lower panels represent magnified views of upper panels. The Ins− and Ins+ panels depict β cells expressing low and high insulin levels, respectively, in tumors. (B) Morphometric measurements of tumor versus insulin-immunoreactive (Ins+) β-cell surfaces observed in 14-month-old βMen1 and control mice. Data represent the means of surface ± SEM. **, P < 0.01 by the Student t test. (C) Mean glycemia ± SEM; **, P < 0.01 by the Student t test.
