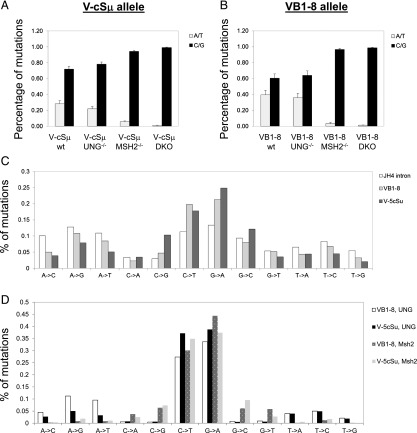
FIGURE 4.
Mutation spectrum in different repair factor–deficient backgrounds. (A) Percentage of A/T and C/G mutations in VB1–8 allele. (B) Percentage of A/T and C/G mutations in VcSμ allele. (C) Mutation spectrum of JH4 intron, VB1–8 and VcSμ alleles in wt mice. (D) Mutation spectrum of VB1–8 and VcSμ alleles in UNG or MSH2-deficient mice.

