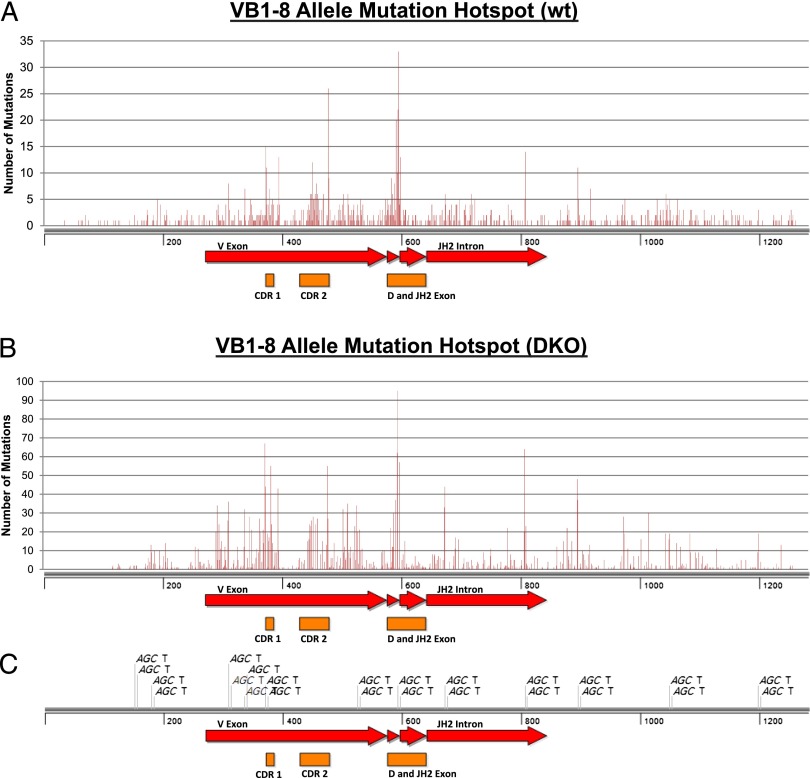
FIGURE 5.
Mutation hotspots in VB1–8 allele. (A) Point mutations from all VB1–8/wt samples were compiled and plotted against base pair position. Mutation hotspots show a strong correlation with the CDR1, CDR2, and CDR3 regions (see details in Table I). Additional mutation hotspots correlated with the position of AGCT motifs on the VB1–8 allele [displayed in (C)]. (B) Point mutations from all VB1–8/DKO samples were compiled and plotted against base pair position. The overall mutation frequency of VB1–8/DKO samples was higher than that of the VB1–8/wt samples (A). The correlation between mutation hotspots and CDR regions or AGCT motifs was observed. (C) Position of AGCT motifs along the VB1–8 KI allele (1–1284 bp).

