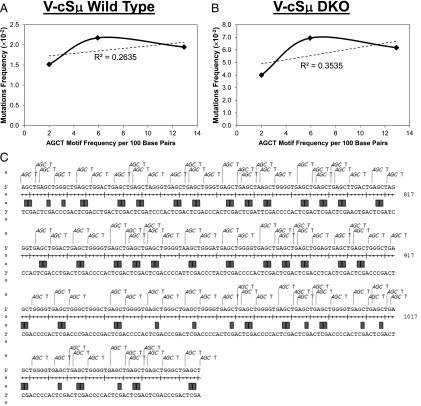
FIGURE 7.
Correlation between AGCT density and mutation frequency. (A and B) Correlation plots for mutation frequency and AGCT density. The mutation frequency of the AGCT sparse, intermediate, and dense regions were correlated with the AGCT motif density (frequency of AGCT motifs per 100 bp) in the V-cSμ/wt (A) or V-cSμ/DKO (B) samples. The frequency of mutations did not correlate with the density of the AGCT motif proportionally. (C) A detailed analysis of the highly targeted hotspots in the AGCT dense region of the V-cSμ KI allele in DKO mice. The highly targeted hotspots (orange rectangles) almost exclusively occur at C/G base pairs within the AGCT motifs, reflecting the footprint of AID deamination in this region. A highly targeted hotspot was defined as any nucleotide with >15 substitutions, which ranks roughly in the 73rd percentile for all mutations.

