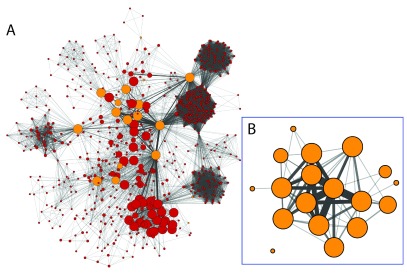
Figure 3. Co-authorship networks for ADC researchers at Rush University Medical Center.
( A) Each node represents an author from the set of publications that have at least one Rush ADC researcher. Orange nodes are Rush ADC researchers and red nodes are non-Rush ADC researchers. Rush ADC researchers were selected manually and their node fill color was modified using the style bypass option and set to orange. This can also be achieved by importing a node attribute mapping only to the query authors and using the imported attribute to select the nodes. Node size represents the cumulative number of the author’s publication citation counts as automatically retrieved from PubMed based on the set of publications associated with the node (the count only includes citations of publications that are in PubMed Central). Edge thickness represents the number of publications the two authors have published together. ( B) Subset of the network in ( A) containing only the ADC researchers. Author names are not shown to reduce visual clutter and to protect anonymity. Large cliques represent many-author publications.

