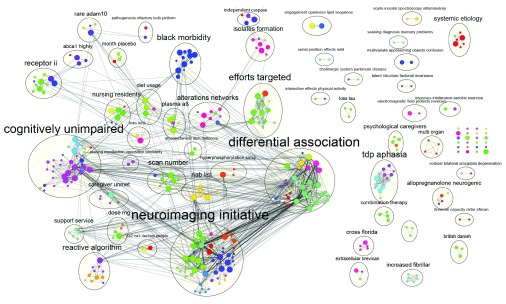
Figure 4. Co-authorship network for all ADC researchers from Alzheimer’s publications in 2010.
Each node represents an ADC researcher and its color represents their institution (as specified in the original dataset). Node colors were automatically generated in the visual style for the ‘original institution’ attribute that was available for this author set and loaded onto the co-authorship network after its creation. Node size represents the cumulative number of the author’s publication citation counts as automatically retrieved from PubMed based on the set of publications associated with the node (the count only includes citations of publications that are in PubMed Central). Thickness of the edges connecting the nodes represents the number of publications the two authors have published together. Each cluster of authors, as calculated by the clusterMaker app 4 , is annotated with an additional circle around its members. Cluster labels aim to summarize the group with the two most frequent words in the author’s set of publication titles as computed by the WordCloud App 5).

