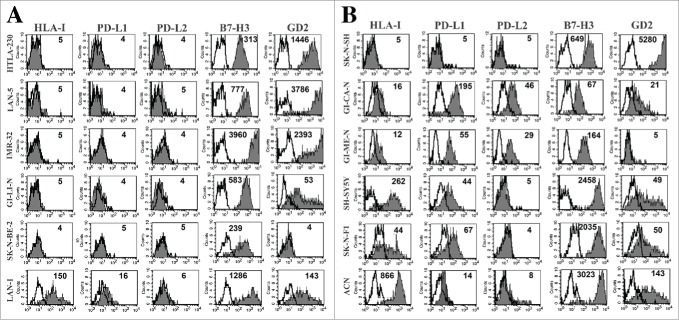
Figure 1.
Analysis of the constitutive expression of PD-L1 and PD-L2 in NB cell lines. Representative cytofluorimetric analysis of the expression of PD-L1, PD-L2 and HLA-I in MYCNampl (panel A) and non-MYCNampl (panel B) NB cell lines. B7-H3 and GD2 are shown for comparison. White profiles refer to cells incubated with isotype-matched controls. Values inside each histogram indicate the Median Fluorescence Intensity (MFI).

