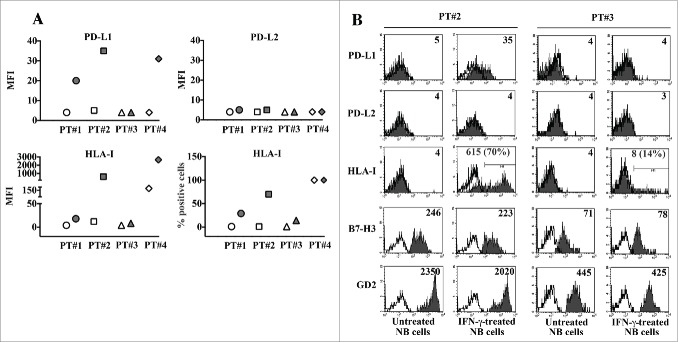
Figure 4.
Analysis of the constitutive and inducible PD-L1 and PD-L2 expression in neuroblasts from NB patients. Panel A: Neuroblasts from (CD45-depleted) bone marrow aspirates of stage M patients (GD2pos B7-H3pos), untreated (white symbol) or treated with IFNγ over 5 d (gray symbol) were analyzed by flow cytometry for the expression of the indicated molecules. Raw values are plotted. Patient 1 (PT#1) (MYCNampl), Patient 2 (PT#2) (MYCNgain), Patient 3 (PT#3) (MYCNgain), Patient 4 (PT#4) (non-MYCNampl). MFI or percentage of positive cells are indicated. Panel B: Representative cytofluorimetric analysis of PD-L1, PD-L2 and HLA-I expression in IFNγ-responsive (PT#2) and IFNγ-unresponsive (PT#3) neuroblasts. White profiles refer to cells incubated with isotype-matched controls. Values inside each histogram indicate the MFI and, in brackets, the percentage of positive cells.

