
Figure 5.
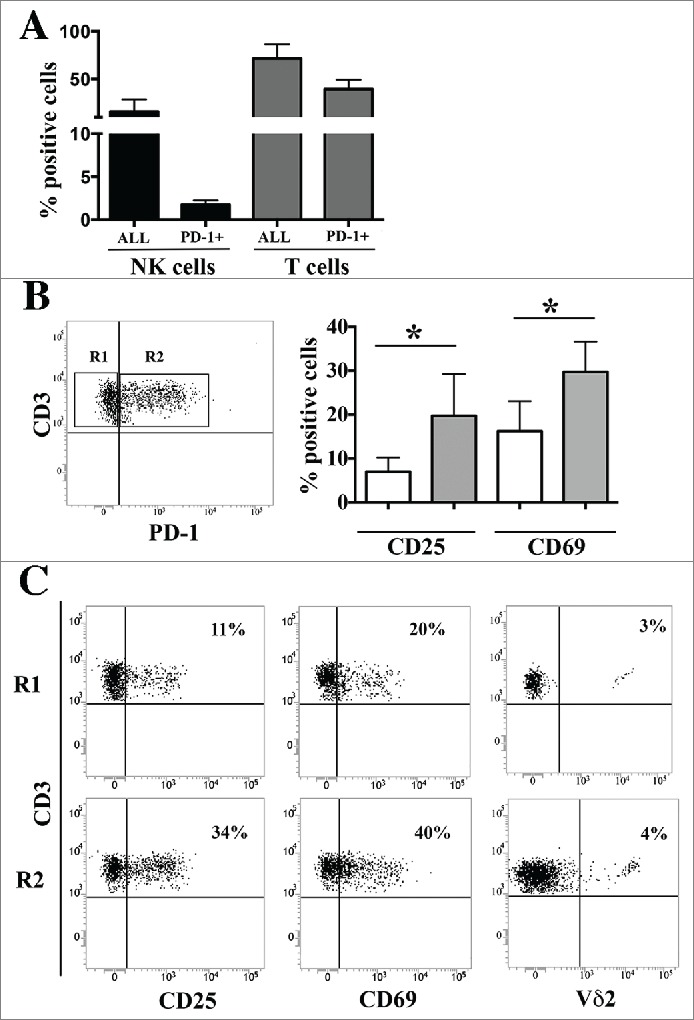
Surface expression of PD-1 in lymphocytes from NB-infiltrated bone marrow aspirates of patients with stage M. Panel A: Bone marrow infiltrating NK and T cells were analyzed by multicolor flow cytometry. The percentage of the two lymphocyte populations and of the PD-1pos subsets is shown. Mean and 95% confidence intervals are indicated. Panel B: Gating strategy (left) and CD25 and CD69 expression (right) in CD3pos PD-1neg (R1, white bars) and CD3pos PD-1pos (R2, gray bars) T cells. Mean of percentage of positive cells, MFI and 95% confidence intervals are indicated. * p < 0 .05. Panel C: Representative cytofluorimetric analysis of CD25, CD69 and Vδ2 expression in CD3pos PD-1neg (R1) and CD3pos PD-1pos (R2) T cells. Percentage of positive cells and MFI are indicated.