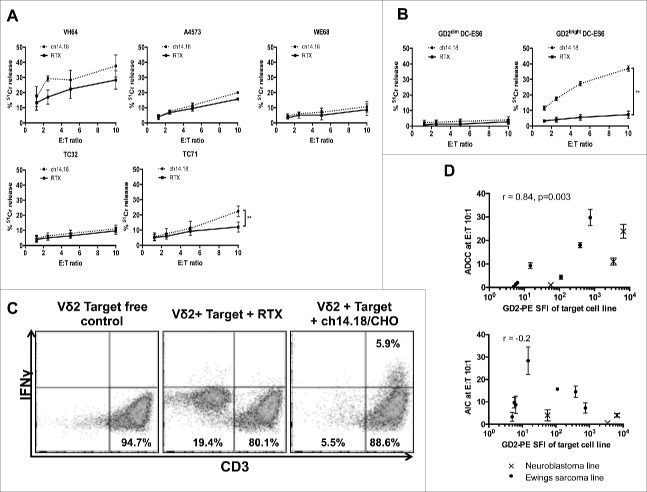
Figure 3.
(A) Killing of wild-type Ewing's sarcoma cell lines by expanded Vδ2+ γδT cells opsonized with ch14.18/CHO anti-GD2 antibody or in the presence of a control antibody (Rituximab) (n = 3–6, **p = 0.0099). (B) Killing of isogenic GD2bright and GD2dim DC-ES6 Ewing's cell lines by Vδ2+ γδT cells in the presence of ch14.18/CHO anti-GD2 opsonizing antibody or Rituximab control antibody (n = 3, ***p = 0.0033). (C) IFNγ expression of Vδ2+ γδT cells in the presence of GD2bright DC-ES6. Elimination of the DC-ES6 population and production of IFNγ is only seen when DC-ES6 is opsonized with ch14.18/CHO. (D) Correlation between the GD2 stain (PE-SFI) of Ewing's sarcoma and neuroblastoma cell lines and the degree to which Vδ2+ γδT cells exert ADCC or AIC against them at effector:target ratio 10:1. R value calculated by Spearman correlation.

