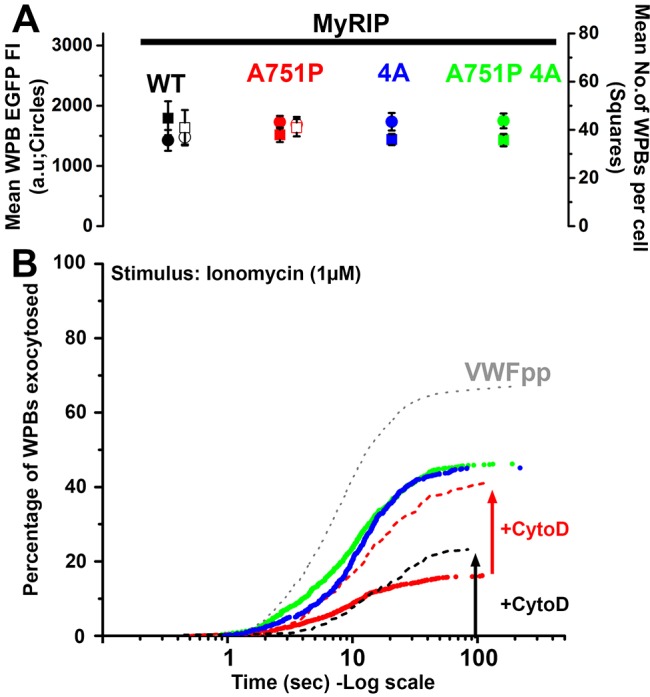
Fig. 7.

MyRIP-actin interaction regulates WPB exocytosis. (A) Mean±s.e.m. for the WPB-associated EGFP fluorescence intensity (solid circles) and numbers of fluorescent WPBs (solid squares) in cells expressing MyRIP WT (black, n=7), MyRIP A751P (red, n=28), MyRIP 4A (blue, n=23) and MyRIP A751P 4A (green, n=19). Open symbols show data for cells pre-treated with cytochalasin D (1 µM, 20 min). (B) Cumulative plots of the total number of WPB fusion events detected during ionomycin stimulation (1 µM, applied at t=0 s) for HUVECs expressing VWFpp–EGFP (grey dotted line, n=19 cells, 1074 fusion events, delay to first fusion event, 1.72±0.13 s; mean±s.e.m.), MyRIP WT (no trace, n=7, 0, 0 s), MyRIP A751P (red symbols, n=28, 219, 11.82±4.56 s), MyRIP 4A (blue symbols, n=23, 556, 5.05±0.97 s), MyRIP A751P 4A (green symbols, n=19, 557, 4.03±0.68 s). Dashed lines show data in cells treated with cytochalasin D (+CytoD, 1 µM, 20 min) expressing MyRIP WT (black dashed line, n=14, 91, 8.54±1.78 s) or MyRIP A751P (red dashed line, n=19, 320, 4.44±0.98 s). Delays were compared using ANOVA multiple comparisons with multiplicity adjusted; P-values are given in the main text. Data are scaled to the mean fraction of fluorescent WPBs that underwent fusion in each condition (VWFpp, 65.5±3.2%, n=19 cells; MyRIP WT, 0%, n=7 cells; cytochalasin-D-treated MyRIP WT, 23.2±1.7%, n=14 cells; MyRIP A751P, 17.6±3.4%, n=28 cells; cytochalasin-D-treated MyRIP A751P, 40.89±3.58%, n=19 cells; MyRIP 4A, 47.9±4.1%, n=23 cells; MyRIP A751P 4A, 50.1±4.1%, n=19 cells; mean±s.e.m.).
