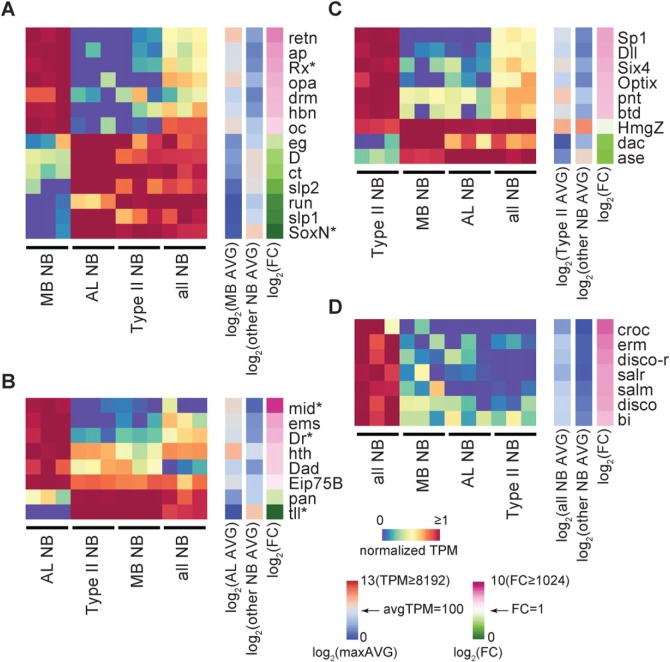
Fig. 5.
TFs characteristic of specific NB subsets. TFs selected via comparisons of MB with other NBs (A), AL with other NBs (B), type II with other NBs (C), and all NB with other NBs (D) (q-value <0.05, using limma-voom package and Benjamini-Hochberg correction). TPM values normalized by the average of the most strongly expressed group are shown as a heatmap. Side bars: average TPM and fold change (FC) values in log2 scale. Asterisks indicate the genes for which protein expression pattern was analyzed by immunostaining.

