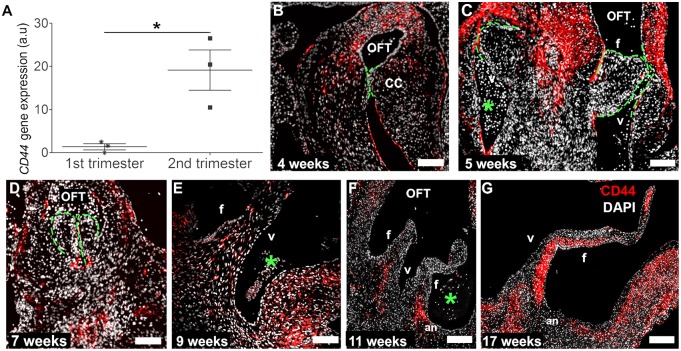
Fig. 4.
Increased expression of CD44 from the first to the second trimester and the spatiotemporal pattern of CD44 protein expression. CD44 gene (A; *P<0.05, n=3) and protein (B-G) expression analyses reveal the distinct temporal and spatial patterns of CD44+ cells (red) during human semilunar valvulogenesis. DAPI is in white. The green lines highlight the semilunar cushions. OFT, outflow tract; f, fibrosa; v, ventricular side; CC, cardiac cushions; an, leaflet annulus; asterisks, erythrocytes. Scale bars: 200 µm in B-E; 400 µm in F,G.

