Fig. 4.
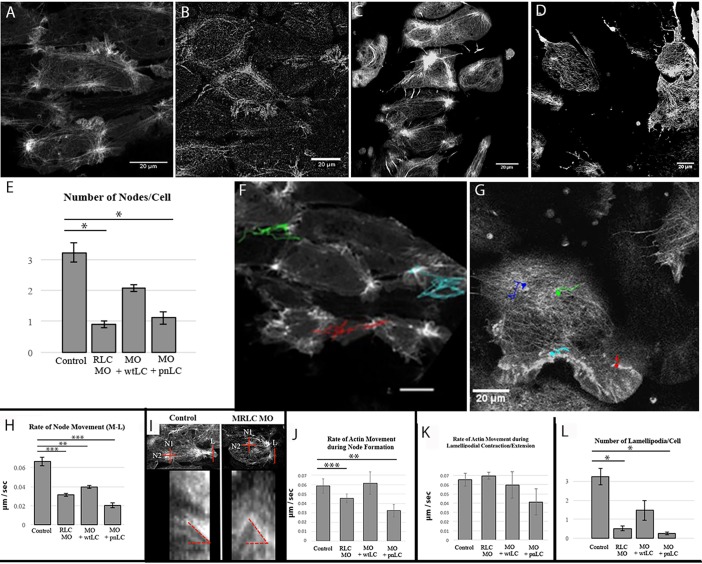
Actin structures depend on RLC phosphorylation. (A) Imaging of the cortical actin structures in control cells reveals a normal cortical actin structure. (B) An RLC morphant cell exhibits a reorganization of cortical actin. This effect is partially rescued by wtRLC expression (C), but not pnRLC expression (D). (E) These differences are quantified by comparing the number of node structures per cell (n, at least 22 cells assayed/condition). Dots represent the starting point of the node and the lines represent the node displacement for a control cell (F) and RLC morphant cell (G) are shown. (H) Rate of node movement (at least 9 nodes assayed per condition). Quantification of kymograph analysis of cortical actin in the regions shown (I), shows a reduction in the rate of actin movement during node formation that depends on RLC phosphorylation (J). (K) By contrast, actin movement in lamellipodia is not sensitive to RLC depletion. For J,K, at least 48 kymographs were averaged for each condition. (L) The number of new lamellipodia per cell also depends on RLC phosphorylation (n is at least 31 lamellipodia for each condition). All MOs are at 10 µM. Scale bars: 20 μm. Error bars represent s.e.m. *P<0.05, **P<0.005, ***P<0.001.

