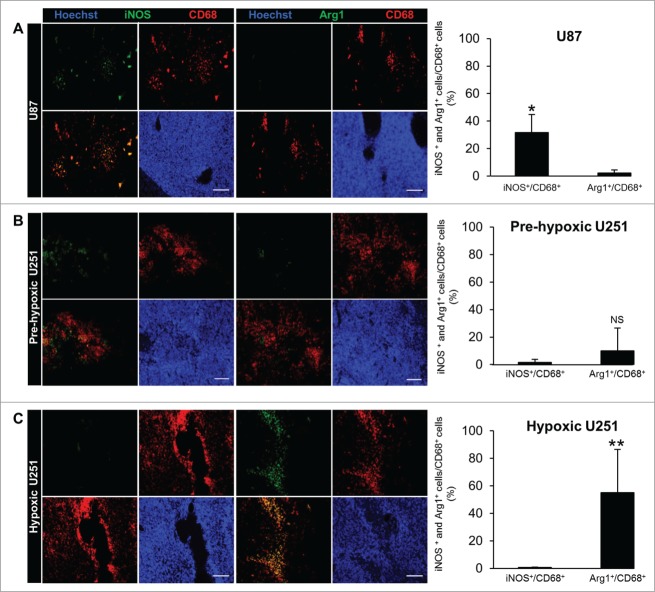
Figure 2.
MΦ polarization in tumor models of human GBM. Representative Arg1, iNOS, CD68 and Hoechst 33342 immunofluorescence images and their respective quantifications in the U87 (A), pre-hypoxic (B) and hypoxic (C) U251 tumors. Scale bars: 100 µm. n = 3 animals per group and per time. Statistical significance was achieved when p < 0.05 (*) or p < 0.01 (**), otherwise it was not significant (NS).

